What Do GitHub Contribution Graph Colors Mean?
GitHub contribution graph colors show how much qualifying activity is associated with each calendar day. The empty cell is the baseline for no displayed activity, and progressively stronger shades indicate more activity in the graph's visual scale. That makes a year of work scannable, but it does not turn a square into a precise public record of every commit.
The useful distinction is between data and presentation. GitHub decides which activity counts and which details are visible. A renderer then maps the daily value to a fill color, SVG stop, pixel, or 3D surface. A custom palette can make a README or portfolio easier to brand, yet it should preserve the original ordering from quiet days to active days.
If you arrived here because a square changed color or a tool shows a different shade, start with the official profile graph. The contribution graph rules guide explains counted repositories, branches, emails, private activity, and update timing. This page stays focused on reading and presenting colors after the source data is understood.
The safest interpretation is relative: a darker square means more displayed activity than a lighter square in that same graph and period. It does not prove code quality, effort, review depth, or the exact number of commits. Keep that boundary visible whenever you export the graph as an image or place it in a public README.
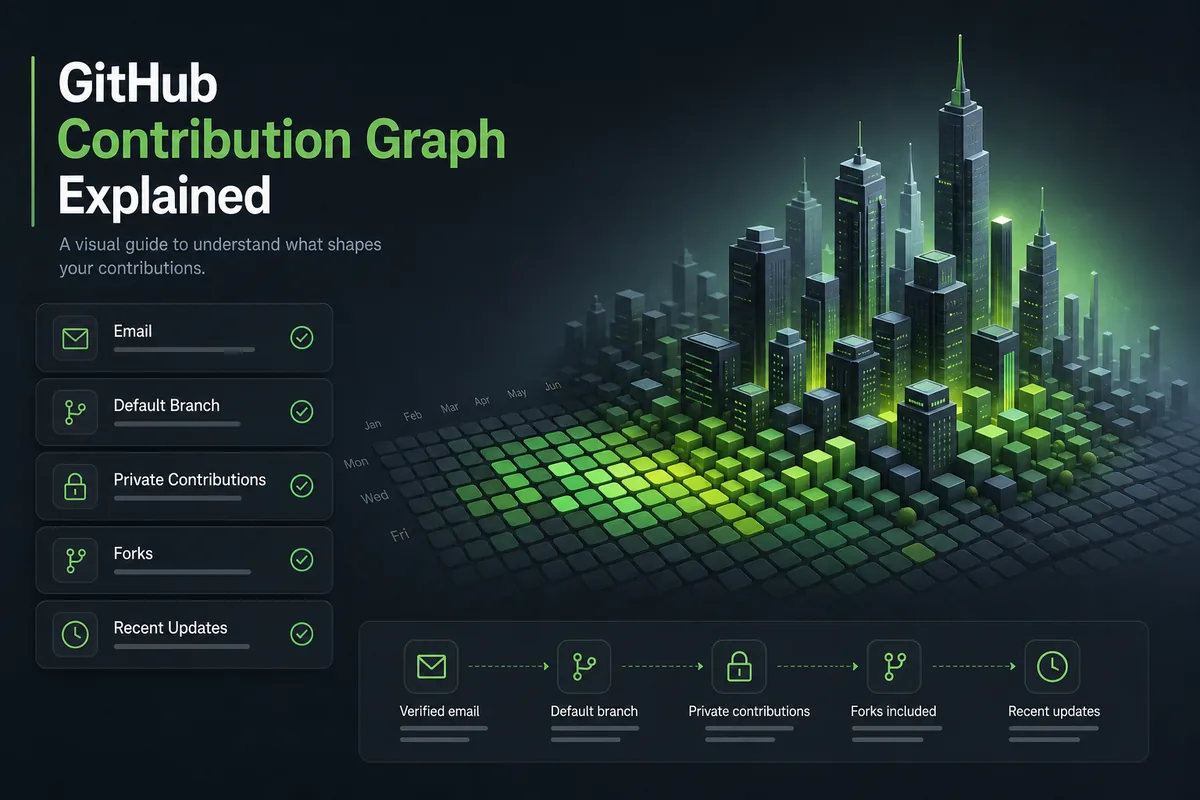
How the GitHub Contribution Graph Color Scale Works
A contribution calendar normally uses a small ordered palette. At one end is the empty or neutral cell. The next levels represent increasing daily activity, and the strongest level represents the highest band visible in the selected period. The exact number of bands and their hex values can differ between GitHub's interface, a README image service, and a custom SVG. Preserve the order even when you change the hue.
Do not reverse the scale because a brand color looks attractive. If a pale cell means a busy day and a dark cell means a quiet day, readers will infer the opposite of the source graph. Test the palette with a small legend that labels low, medium, and high activity in words. When a tool normalizes a selected date range, say so: the darkest color may be the busiest day in that range, not a universal contribution threshold.
The calendar also has a spatial grammar. Columns usually represent weeks and rows represent weekdays, so adjacent cells are not interchangeable decorative dots. A color change can show a weekend pattern, a release week, or a long pause. Explain the time window and keep the day order intact when exporting to PNG, SVG, or a 3D visualization.
| Visual level | Safe reading | What not to claim |
|---|---|---|
| Empty / neutral | No displayed qualifying activity for that day | Do not claim the person did no work anywhere. |
| Light shade | Lower activity band in this graph | Do not convert it into an exact commit count. |
| Middle shade | More activity than lighter cells | Do not compare across tools without checking normalization. |
| Dark shade | Higher activity band in this graph | Do not call it a productivity or quality score. |
How to Read the Legend Without Guessing Counts
A legend is a translation layer between color and activity. Read it alongside the graph's date range and repository context. If the legend says fewer contributions and more contributions, use those labels; do not invent numeric cutoffs. GitHub can change interface details, and third-party services may calculate a band from the data they received rather than from the complete profile.
When a day looks unexpectedly pale, inspect the source profile before changing a theme. A missing email association, a fork or branch that does not qualify, private contribution settings, or a refresh delay can change the underlying value. Recoloring the image cannot restore activity that was never present in the source data.
For a portfolio screenshot, include a short caption such as ‘daily contribution activity shown on a relative intensity scale’ and name the period. That sentence prevents a viewer from reading the darkest square as a promise of a fixed number. If you provide a download, keep the legend next to the image or include equivalent text in the surrounding HTML.
Confirm the period
Identify whether the graph shows a rolling year, a calendar year, or a custom window before comparing colors.
Find the neutral cell
Use the empty cell as the baseline and check whether the renderer uses a distinct border or background.
Read the ordering
Move from light to dark in the legend and verify that each step represents more displayed activity.
Check the source graph
When a result looks wrong, inspect GitHub's profile and contribution settings before changing the palette.
Add a text caption
Describe the scale and time window so readers who cannot distinguish hues still understand the image.
Choosing a Theme for a README Image
A custom theme is useful when the default green does not fit a dark README, a monochrome portfolio, or a product brand. Treat the color choice as a controlled mapping: keep the empty state visibly empty, keep each activity step ordered, and make the highest band easy to find without making every cell look saturated. A hue swap is safer than changing the number of levels.
Contrast matters more than novelty. Test the lightest filled cell against the background and check that the empty cell does not disappear. Then view the image in light mode, dark mode, and a grayscale preview. People with red-green color-vision differences should still be able to follow the ordering through lightness, a legend, or labels. A custom palette that passes only on your monitor is not a reliable README asset.
Keep the source and transformation visible. Link to the generator or repository, state that the image is a presentation of GitHub contribution data, and avoid labels such as ‘output’ or ‘productivity’ that imply a score. If private contributions are anonymized, do not add repository names or infer what the hidden activity represents.

- Export a GitHub contribution graph image — Use the image guide after deciding whether PNG or SVG fits the presentation.
- Check GitHub contribution graph rules — Use the rules guide when the source data looks incomplete.
A Color Customization Workflow That Stays Honest
Start with the source data, not a screenshot. Open the public profile, note the time window, and decide whether the output is for a README, a poster, a dashboard, or an interactive 3D view. Each destination has different space and contrast constraints. A small README image needs a compact legend; an interactive tool can offer a hover label and a larger explanation outside the canvas.
Next choose a palette with named roles instead of a list of attractive hex values. Define neutral, low, medium, and high activity colors. Keep the roles in an object or configuration file so a later redesign cannot accidentally swap them. If you use a community generator such as gitcolors, read its setup and theme documentation, preserve attribution where required, and verify that its output still contains a legend or surrounding explanation.
Finally test the result at its real size. A five-color scale that looks clear at 1200 pixels can collapse into two indistinguishable blocks at 300 pixels. Check keyboard or screen-reader text around the image, make sure the link opens the actual source, and record the date the graph was captured. These steps turn a decorative customization into a reproducible, honest presentation.
Example palette roles
const palette = {
  empty: '#161b22',
  low: '#0e4429',
  medium: '#26a641',
  high: '#39d353',
};
These values illustrate named roles, not an official GitHub threshold or a universal hex palette. Test the contrast and label the scale in your own output.
Capture the source context
Record the username, date range, profile URL, and whether private contributions are shown or anonymized.
Assign palette roles
Name the neutral, low, medium, and high colors before selecting a hue family or monochrome ramp.
Preserve the data order
Map stronger activity to stronger visual emphasis and keep the weekday/week structure unchanged.
Test contrast and grayscale
Review light and dark backgrounds, a grayscale copy, and a color-vision simulation if available.
Publish the explanation
Place a legend, alt text, capture date, and source link beside the exported image or visualization.
Keep Color Separate From Contribution Context
Color is a compact summary, so it can hide important context. GitHub's profile reference says contributions depend on factors such as the associated commit email, a standalone repository, a default or gh-pages branch, and the visibility of private activity. A dark square cannot tell a reader which of those conditions produced it. Link to the official rules when your article, portfolio, or tool needs to explain why a day is empty.
The graph also has a time dimension. A recent commit may not be visible immediately, and a rebased commit can use author-date rules that differ from the repository timeline. When you compare two exports, capture them on known dates and use the same renderer. Otherwise a color difference may reflect a refresh, a date boundary, a theme, or a normalization choice rather than a change in activity.
Use the same discipline in a 3D view. GitHub City can make a contribution pattern easier to explore, but a building height or color is still a visualization of available contribution data. It is not a private repository browser, a code-quality grade, or a complete productivity record. Keep the official graph and the source date one click away from the visual output.
| Question | Use the color guide for | Use another source for |
|---|---|---|
| Why is a square empty? | Describe the neutral visual state | Check GitHub's contribution criteria and refresh timing. |
| Can I recolor a graph? | Choose an ordered presentation palette | Do not imply that GitHub's profile interface changed. |
| Which export should I use? | Match contrast and legend to the destination | Read the PNG/SVG output guide for file trade-offs. |
| What does a 3D building mean? | Explain the visualization boundary | Read the 3D tool comparison and source data notes. |
GitHub Contribution Graph Colors FAQ
What do GitHub contribution graph colors mean?
They encode relative daily contribution activity in the graph's selected scale. Empty cells mean no displayed activity; darker cells mean a higher activity band for that graph.
Does a dark square equal one commit range?
No. The shade is not a universal commit range. Activity can include several contribution types, and renderers can normalize or theme the values differently.
Where can I find GitHub contribution graph hex colors?
A renderer or theme repository may publish hex values, but those values describe its presentation. Treat them as configuration, verify contrast, and do not call them official counting thresholds.
Can I use a custom graph theme in a README?
Yes, when the output is clearly presented as a visualization of contribution data. Keep a legend, add descriptive alt text, link to the source, and avoid claims about productivity or code quality.
Why do colors differ between GitHub City and a README image?
The tools may use different palettes, date windows, privacy handling, or normalization. Compare the source graph and capture dates before interpreting a shade difference.
What should I do when my GitHub graph is missing contributions?
Check the official contribution rules first: account email, repository and branch eligibility, private contribution settings, and update timing. A new palette cannot fix missing source data.
Sources and related guides
Explore the same contribution pattern in 3D
After checking the source graph and its date range, use GitHub City as a visual companion for a public contribution pattern. Open GitHub City